Intermediate / Mobile performance
Profile a Small Canvas Game before Optimizing It
A small Canvas game can feel uneven even when its source looks simple. Before replacing arrays, reducing visual detail, or adding an object pool, measure which work actually occupies the main thread. Otherwise an optimization can make the code harder to understand without improving play.
What you'll build
We will define a repeatable profiling session for Gem Collector and distinguish update cost, drawing cost, DOM work, and display workload. This article provides a method rather than fabricated benchmark numbers for devices that were not tested.
Prerequisites
Use a browser with performance developer tools and understand the collector's update/draw split. Read demo.js for status updates and collector.js for object processing. Keep a copy of the current source as your baseline.
Fix the scenario before comparing results
Record viewport size, device, browser, difficulty, and whether the game is running inside an article or on its dedicated page. Different difficulty settings change object frequency and speed, while a larger backing buffer changes drawing work. Comparing unrelated scenarios produces misleading conclusions.
Use the same active duration for each capture. A seeded object sequence can improve repeatability, but input and timing also need control. At minimum, describe how the paddle was moved and whether the run ended early.
Desktop mobile emulation is useful for layout and throttling experiments, but it is not a replacement for a real phone's processor, thermal behavior, display, or browser. Label the environment accurately when reporting results.
Inspect a performance recording
Start a recording after the page is ready, play a short controlled segment, then stop. Look for long tasks and repeated work in update, draw, and event handlers. Do not assume that a low average duration means every frame is smooth; occasional long tasks can still interrupt input.
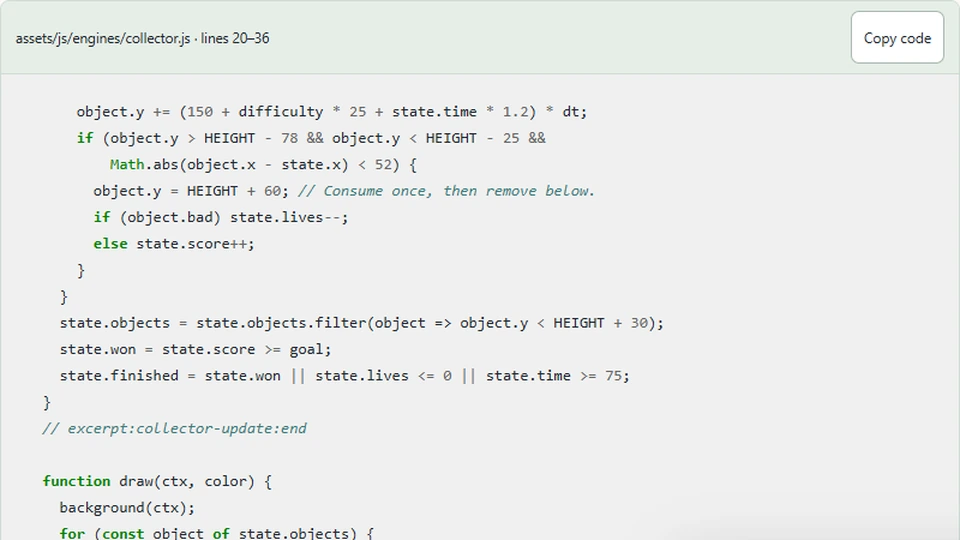
The collector's model work includes moving objects, checking contact, and filtering survivors. Rendering paints a background and each visible object. The wrapper also updates text when status changes. These are separate candidates, and the trace should guide which one to inspect first.
      object.y += (150 + difficulty * 25 + state.time * 1.2) * dt;
      if (object.y > HEIGHT - 78 && object.y < HEIGHT - 25 &&
          Math.abs(object.x - state.x) < 52) {
        object.y = HEIGHT + 60; // Consume once, then remove below.
        if (object.bad) state.lives--;
        else state.score++;
      }
    }
    state.objects = state.objects.filter(object => object.y < HEIGHT + 30);
    state.won = state.score >= goal;
    state.finished = state.won || state.lives <= 0 || state.time >= 75;
  }
  // excerpt:collector-update:end

  function draw(ctx, color) {
    background(ctx);
    for (const object of state.objects) {
If the trace is dominated by unrelated browser extensions or developer-tool activity, repeat in a cleaner environment. Measurement setup is part of the evidence, not a detail to omit from a performance claim.
Avoid per-frame DOM churn
The wrapper's report function writes status only when the string changes. The displayed timer uses whole seconds, so it does not need a new DOM assignment for every animation callback. Memory's controls are created on reset rather than recreated continuously.
Those choices keep the document stable while Canvas handles the picture. If a profile shows layout or style recalculation, inspect whether a new feature reads geometry and writes styles repeatedly inside the frame loop. Batch or reduce that work only after identifying the actual path.
Do not remove useful status or keyboard semantics merely to reduce a small measured cost. Optimize how they update before sacrificing the controls that make the example understandable and usable.
Evaluate allocation changes with evidence
Filtering the object array creates a survivor array each update. That is a visible allocation opportunity, but it may be insignificant at these object counts. An in-place compaction or object pool adds bookkeeping and reset risks.
Measure before and after one isolated change. Verify scoring and cleanup tests still pass, then compare the same scenario. If the result is within ordinary run-to-run variation, report that limitation rather than declaring a speedup from one favorable trace.
The same caution applies to drawing optimizations. Offscreen buffers and cached artwork can help some scenes, but they also consume memory and complicate resize behavior. A few circles may not justify them.
Watch display density and visibility
A high-density buffer increases the number of pixels drawn even when the logical scene is unchanged. Record buffer dimensions, not only CSS width. If a future renderer caps pixel ratio, compare visual quality and frame cost on the same device.
Pause when the tab becomes hidden and inspect the return-to-play behavior. A large jump after visibility change can be a lifecycle bug rather than insufficient rendering performance. Correct timing policy should be established before tuning drawing speed.
Next steps
Profile Gem Collector, make one justified change in a local copy, and write a short before/after note with the environment and scenario. Keep raw observations separate from conclusions. A reproducible modest result is more useful to another developer than an unsupported claim that the game is “mobile optimized.”